Analyzing Election Maps: Insights from Yale’s Post-Election Panel
On election night, TV viewers have grown accustomed to seeing someone standing beside a large interactive screen displaying a map of the country divided into blue and red states and districts.
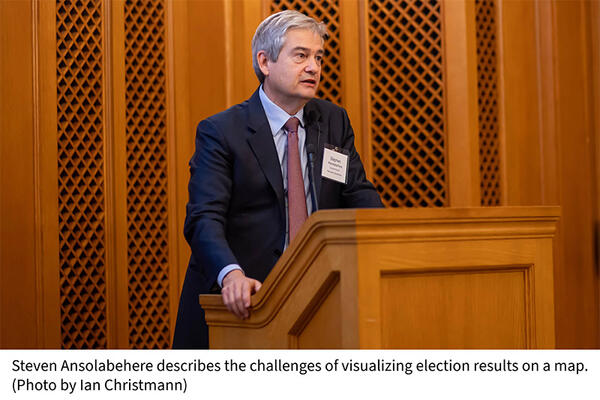
Stephen Ansolabehere, Frank G. Thompson Professor of Government at Harvard University, sees behind that map. Literally. He works at the CBS Decision Desk, located on the other side of the screen, analyzing incoming data to determine who has won and which races are still too early or too close to call.
For Ansolabehere, the calls represent relatively simple mathematical calculations. But translating the narrative of an election into a visual component, such as the maps so popular with TV news organizations, remains an unsolved problem.
“We don’t know how to visualize what we know about elections,” he said. “What map or visualization would you construct to display the election in real time, as it’s unfolding on election night or over the course of a week? What’s the narrative? What’s the story? What should they be putting out there?”
Ansolabehere asked these questions and answered others as part of a post-election discussion sponsored by the Yale Center for Geospatial Solutions (YCGS), in collaboration with the Data-Intensive Social Science Center (DISSC), the Institution for Social and Policy Studies (ISPS), and the Yale Library.
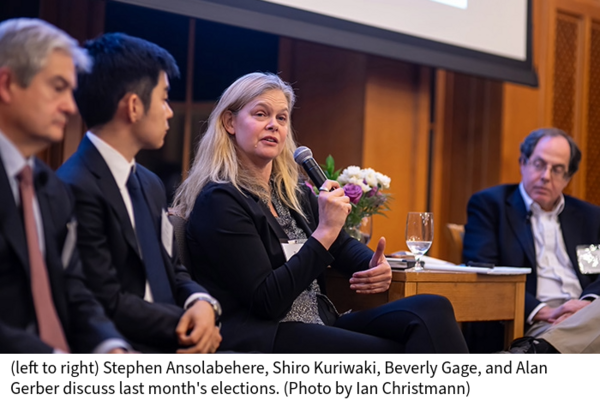
Moderated by ISPS Director Alan Gerber, Sterling Professor of Political Science, the event featured Beverly Gage, John Lewis Gaddis Professor of History; and Shiro Kuriwaki, ISPS faculty fellow and assistant professor of political science.
Because the winners of a statewide election might receive a thin majority or only a plurality of votes cast, coloring that state entirely red or entirely blue reveals little about the overall electorate. Even the reddest or bluest states are really shades of purple. Similarly, coloring dozens of lower-population rural districts one color and a handful of isolated urban districts with much higher populations another color, creates a misleading impression of a state’s partisan makeup.
“You almost couldn’t put together a graphic with less information than the red-blue map,” Gerber said.
Gage, who won the Pulitzer Prize for her 2022 biography of J. Edgar Hoover, said the red-blue map fails to capture how complicated, close, and contested presidential elections have become when compared to the past.
In 1936, Franklin Delano Roosevelt won all but eight of the 531 available electoral votes and 63% of the popular vote. In 1972, Richard Nixon won 520 out of 538 electoral votes and a 23-point margin of victory in the popular vote. Republican Ronald Reagan won a second term in 1984 with 525 electoral votes and nearly 59% of the popular vote. The only blue on that map could be found in Minnesota and Washington, D.C.
Gage contrasted these earlier, overwhelming victories with the most recent election, in which Donald Trump earned 312 electoral votes and slightly under 50% of the national popular vote, for about a 1.5% popular-vote margin in his win over Kamala Harris.
“How can we have an election that is quite close and quite contingent, when so many things have occurred that we haven’t seen before and could have swung the election one way or the other,” she said, “and at the same time say that something really profound, really important, and potentially permanent might have happened?”
Gage argued against painting the electorate with broad strokes and making sweeping conclusions that fail to capture the division within many communities. Instead, she found herself looking toward the past for interpretive guidance. In particular, she said America today reminds her of the late 19th century, when immigration as a percentage of the population was similarly high and drove a backlash resulting in a 1924 law clamping down on the flow of people from other countries.
The Gilded Age of 100 years ago also featured high levels of economic inequality; ferocious partisanship; major challenges for organized labor; and battles over granting government jobs to political allies or building a nonpartisan, professional administrative civil service, she said.
This era led to the Progressive Movement, which aimed to constrain political corruption and curb the political influence of large corporations. And in 1965, the country passed the Immigration and Nationality Act, abolishing racialized national quotas and establishing preferences for immigrants with desirable skills and family connections with current U.S. citizens or residents.
“I think it tells us that this is a kind of plastic moment that can go in a lot of different directions,” Gage said. “Some of them may be more progressive, some of them may be more reactionary.”
Though, she said, this history lesson also features at least one major difference.
“The narrative then was the United States was a nation on the rise, that the future would be better than its past,” she said. “And one of the things that has been sort of striking about American politics in recent years is how few people seem to believe that about the United States or about their own lives anymore.”
Kuriwaki dug into the data beneath the maps to tell a story about ticket splitting, when the same person votes for different parties for different offices in the same election. In four battleground states that helped determine the 2024 presidential race, the winners belonged to a different party than the winners of those states’ U.S. Senate elections.
“Those differences give us some nuance into voter behavior,” Kuriwaki said. “It can tell us what kind of Democratic candidate or what kind of Republican candidate can win voter support.”
For example, Democratic presidential candidate Kamala Harris lost Ohio with a 44% share of the vote while Democratic incumbent Senate candidate Sherrod Brown also lost, but with 48% of the vote. At least 4% of the people who voted split their ticket, choosing Trump but also Brown.
Brown has won elected office in Ohio since the year after graduating from Yale College in 1974, representing the economic realities of the state, often in opposition to national Democratic policy positions that could disproportionately harm the state’s manufacturing workers.
“But even though his traditional base and his policies tend toward more manufacturing-oriented workers without a college education, there are fewer of them today,” Kuriwaki said. “He can no longer get a winning coalition with those voters.”
Brown performed better in rural counties that more often vote for Republicans and did poorly in more urban districts, Kuriwaki said.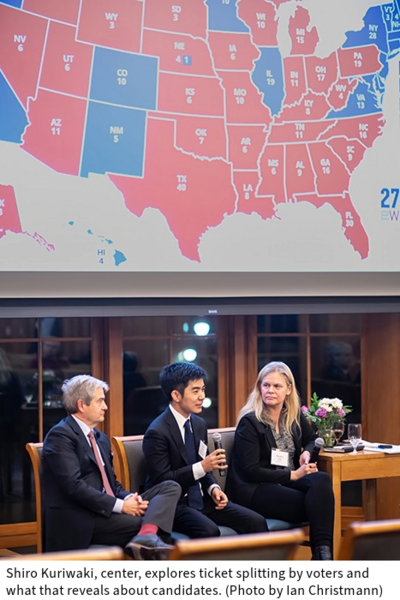
Kuriwaki responded to a question about voters who voted in favor of referendums establishing abortion rights in state constitutions but also voted for Trump, whose Supreme Court picks helped to end the national constitutional right to abortion, or Republicans, some of whom have signaled a willingness to pass a national ban on the procedure. He suggested that voters might have responded to inflation-related anti-incumbent forces while maintaining a desire to keep their policy preference intact, at least temporarily.
While the most precise form of visualizing the results of an election remain elusive, Ansolabehere said forecasting the result in real time with incomplete data presents a fascinating, classic analytics problem, particularly as voters now cast as many as 60% of ballots before Election Day.
“Election Day is no longer the entire election and hasn’t been for a while,” he said. “People don’t know how to process that data.”
Exit polls — surveys of voters taken as they leave polling places and rapidly shared with news organizations — can help set expectations, Ansolabehere said. But they are notoriously unreliable as an accurate prediction of the final results. Instead, he said, the analytical model that works the best is remarkably simple: Take the results of the previous election, take the earliest election returns as they come in from the East Coast, and draw a line.
“Elections are super predictable if you view it through this lens,” he said. “If you view it through a different lens, it’s more confusing.”
The early results showed a 3.8% decrease in Harris’ share of the vote compared with Joe Biden’s from 2020. That number stayed consistent throughout the night.
“At 10:00, we knew this was over,” Ansolabehere said. “There was no way this election would skew the other way. It was happening everywhere.”
Ansolabehere credited the Harris campaign for taking over the huge project of a presidential campaign on such a compressed calendar and extraordinary circumstances.
“Imagine taking over a multi-billion-dollar corporation, which is what a national campaign is,” he said. “I see this as a remarkable success that she was able to do the transition without it becoming a total mess. That said, they had serious losses, and now they have to regroup and rethink.”
Gage mused how the Republican party has become socially conservative, economically populist, and protectionist.
“It’s not a combination we have seen in a long time in the United States,” she said. “It does seem like a pretty powerful and lasting combination and one I don’t think is going to be undone very quickly.”
And while she sees parallels in history that led to a grand realignment of politics in the 1930s under Roosevelt, she, as a careful historian, was not ready to make any proclamations about what the future would bring.
“I don’t think that either one of the parties is going to look the same,” she said. “That makes this a very interesting and a very perilous historical moment.”